Job Market Paper
Building Energy Performance Standards: Impacts on Building Energy Efficiency and GHG Emissions in Washington, DC
Summary
The accelerating urgency of climate change has led cities to adopt performance-based energy policies aimed at reducing emissions from the built environment. This study evaluates the ex post causal impacts of Washington, DC’s Building Energy Performance Standards (BEPS), a U.S. policy that mandates performance improvements among relatively underperforming buildings. Using building-level panel data from 2013–2023, the analysis examines whether BEPS generated measurable reductions in energy use intensity (EUI) and greenhouse gas (GHG) emissions and how responses scale with buildings’ relative pre-policy performance. The results show that BEPS induced substantial improvements in energy efficiency and emissions outcomes, with larger effects among buildings that initially performed worse relative to comparable peers.
Data and Hypotheses
The analysis draws on annual building-level data from the District of Columbia Department of Energy and Environment (DOEE) Open Data portal spanning 2013–2023. The dataset includes weather-normalized site and source EUI, Energy Star scores, total and intensity-based GHG emissions, building size, property type, and ownership status. Policy exposure is captured through a continuous “compliance gap” measuring how a building’s pre-policy baseline performance compares to peer benchmarks defined by property-type averages, property-type efficiency percentiles, and citywide norms. The analysis tests three hypotheses:
- H1: BEPS implementation leads to significant reductions in building energy use and GHG emissions.
- H2: Buildings with larger pre-policy performance shortfalls experience greater post-policy improvements.
- H3: BEPS effects do not vary by building ownership type, with public and private buildings potentially responding similarly to the policy.
Methodology
The empirical framework applies a continuous-treatment two-way fixed effects (TWFE) model to estimate causal effects of BEPS on energy and emissions outcomes. The key regressor is the interaction between the compliance gap and a post-policy indicator, capturing how buildings with greater pre-policy inefficiency respond once the standard becomes binding. Event-study models assess the parallel trends assumption and trace the dynamic impacts of BEPS over time. Robustness checks include alternative gap definitions (property-type mean, percentile, and citywide) and inverse probability weighting (IPW) to address potential attrition bias in the unbalanced panel.
Yit = β₀(Postt × Gapi,v) + αi + τt + εit
Results
The empirical strategy adopts a modern continuous DiD framework with building and year fixed effects. Treatment intensity is defined by the interaction of the compliance gap with a post-policy indicator that becomes binding in 2021. Event-study models assess the parallel trends in the intensity assumption and trace the dynamic evolution of BEPS impacts over time. Robustness checks include alternative gap definitions, inverse probability weighting (IPW) to correct for non-random attrition, and specifications accounting for overlapping federal and local energy policies implemented during the BEPS period.
Table 4.1: BEPS Impacts Estimated with Property-Type Mean Compliance Gaps
| Site EUI (kBtu/ft²) |
Source EUI (kBtu/ft²) |
Energy Star Score |
GHG Emissions (MTCO₂e) |
GHG Intensity (KgCO₂e/ft²) |
|
|---|---|---|---|---|---|
| A: Base Model Estimates | |||||
| Post × Compliance Gap | -0.33*** (0.04) | -0.45*** (0.06) | 0.41*** (0.03) | -0.35*** (0.07) | -0.65*** (0.04) |
| Observations | 11,937 | 11,937 | 10,686 | 11,937 | 11,937 |
| Entities | 1,997 | 1,997 | 1,810 | 1,997 | 1,997 |
| R² (within) | 0.106 | 0.21 | 0.054 | 0.21 | 0.34 |
| B: Estimates with overlapping policies | |||||
| Post × Compliance Gap | -0.33*** (0.04) | -0.45*** (0.06) | 0.41*** (0.04) | -0.35*** (0.08) | -0.65*** (0.04) |
| Observations | 11,937 | 11,937 | 10,686 | 11,937 | 11,937 |
| Entities | 1,997 | 1,997 | 1,810 | 1,997 | 1,997 |
| R² (within) | 0.11 | 0.22 | 0.05 | 0.22 | 0.34 |
| C: IPW-Weighted Estimates | |||||
| Post × Compliance Gap | -0.32*** (0.04) | -0.44*** (0.06) | 0.42*** (0.04) | -0.54*** (0.06) | -0.76*** (0.02) |
| Observations | 11,281 | 11,281 | 10,686 | 11,281 | 11,281 |
| Entities | 1,810 | 1,810 | 1,810 | 1,810 | 1,810 |
| R² (within) | 0.10 | 0.22 | 0.05 | 0.21 | 0.24 |
This table reports continuous DID estimates of the impact of BEPS using the mean compliance gap. Panel A reports unweighted estimates. Panels B and C report inverse probability weighted (IPW) estimates that correct for non-random building attrition and control for overlapping federal (2021) and local (2020) energy subsidy programs. All models include building and year fixed effects. Standard errors are clustered at the building level. Significance levels: *** p < 0.01, ** p < 0.05, * p < 0.10.
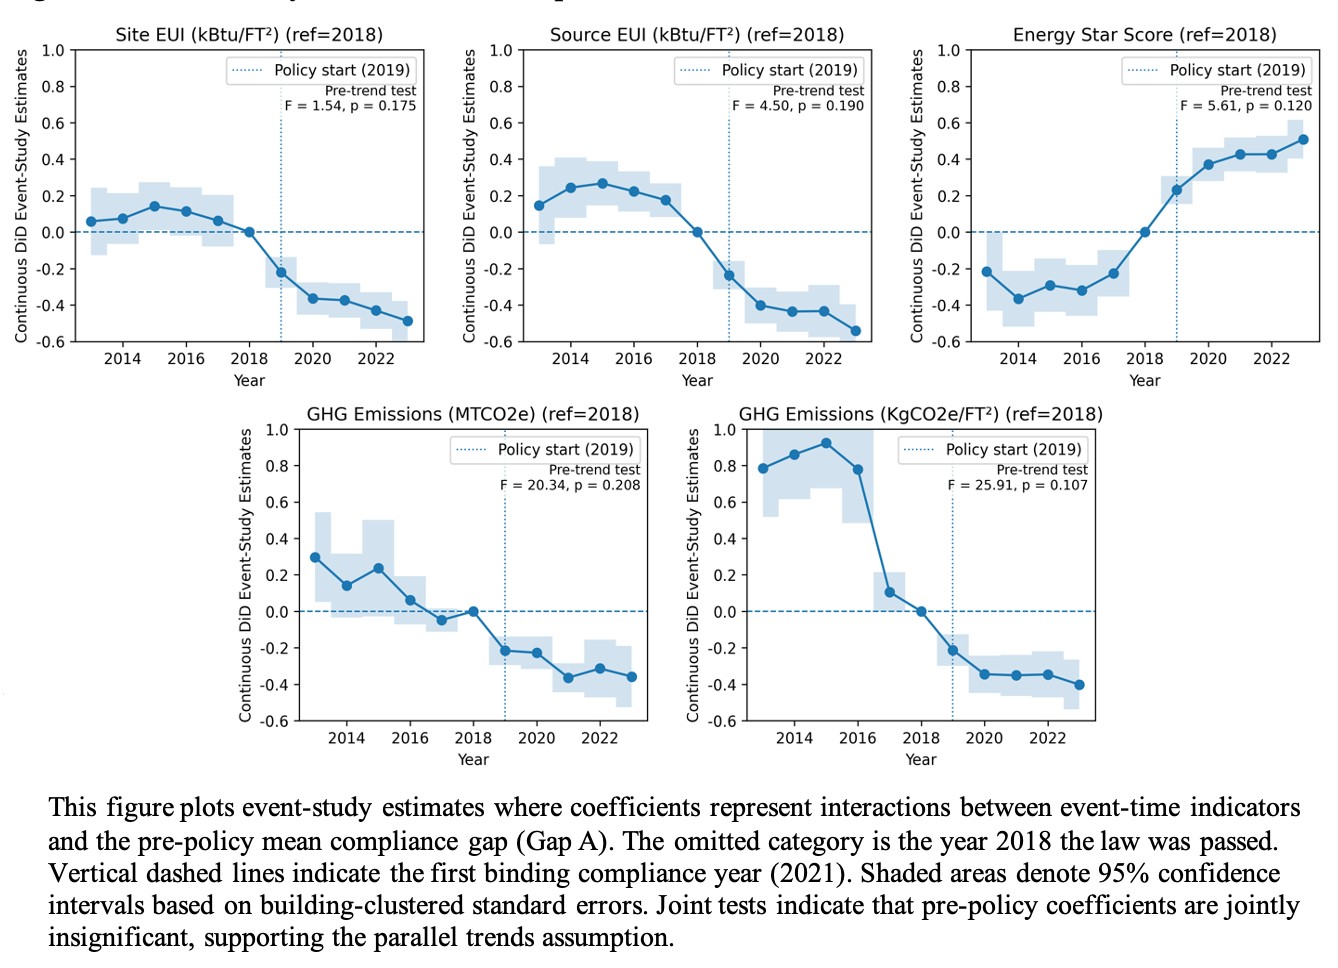
Figure 1: Event-Study Plots of BEPS Impacts
Contribution
This study contributes to the literature on urban energy policy and building decarbonization by providing one of the first causal, ex post evaluations of BEPS using building-level data. By framing BEPS as a performance-based regulation with heterogeneous treatment intensity, the analysis demonstrates how mandatory standards can generate scalable efficiency and emissions gains without relying on a treated–control comparison. The results show that BEPS responses are primarily driven by baseline underperformance rather than building ownership status, underscoring the role of enforceable, peer-based benchmarks in accelerating building-sector decarbonization.